Key takeaways
- The formula is (converted leads ÷ total leads) × 100, and one rate is four or five rates multiplied together. The single number tells you the funnel leaks. It never tells you where, which is why a brief to improve conversion so often goes nowhere.
- Every rate is a choice of denominator, and the choice changes the answer. One week of real data can honestly produce 7.5%, 10% and 15.4% depending on who counts.
- The stage nobody counts sits between a booked meeting and a held meeting. Most funnel reporting stops at the booking confirmation, which is where a measurable share of pipeline quietly disappears.
- The numbers you need live in three separate systems. Visitor counts in analytics, submissions in your form tool, stage changes and customers in the CRM. Reconciling them is most of the work.
- An industry average is the least useful number here. Your own rate from the previous quarter, split by source, beats any benchmark whose population you cannot inspect.
That one line is the entire formula, and it is also the reason the metric disappoints the people who report it. The number is a product of several transitions, and each one hides a decision about what counts.
Two teams can run the identical funnel, count honestly, and report rates three percentage points apart. One counts every form submission; the other counts only the submissions a human agreed to work. Neither is lying. They are measuring different things with the same word.
The formula, and the three choices hidden inside it
Lead conversion rate = (leads that converted ÷ total leads) × 100.
Forty submissions in a week, four of which became paying customers, gives you (4 ÷ 40) × 100 = 10%.
Three decisions sit inside that line, and each one moves the result:
- What counts as a lead. Every form submission, or only the ones that pass qualification? Duplicate submissions from the same person? The contact who downloaded a PDF and never replied?
- What counts as a conversion. A signed contract, a first payment, a booked demo, a sales-accepted lead. All four are called conversion in different companies.
- Which period owns the number. Leads that arrived in the period, or conversions that closed in the period? These are not the same cohort, and mixing them is the most common reporting error in this whole metric.
Write all three down before you calculate anything, then keep them stable. The first change you see after measuring properly is usually a decline, caused by counting honestly rather than by selling worse.
Five rates from one cohort of visitors
Here is a worked illustration, sized to look like a real B2B week. One thousand people reached the pricing page, and that cohort is tracked forward until it resolves rather than being cut off when the week ends.
| Transition | Count | Rate at this step |
|---|---|---|
| Visitors to the pricing page | 1,000 | n/a |
| Submitted the form (visitor to lead) | 40 | 4.0% |
| Passed qualification (lead to qualified) | 26 | 65.0% |
| Booked a meeting (qualified to booked) | 18 | 69.2% |
| Meeting went ahead (booked to held) | 13 | 72.2% |
| Became a customer (held to customer) | 4 | 30.8% |
The headline lead-to-customer rate is 4 ÷ 40 = 10.0%. Multiply the four rates below the form step and you get the same answer: 0.65 × 0.692 × 0.722 × 0.308 = 10.0%. Include the visitor step and the end-to-end visitor-to-customer rate is 4 ÷ 1,000 = 0.4%.
If your reporting uses the standard labels, they map onto this table: visitor-to-lead is the first row, MQL-to-SQL sits inside lead-to-qualified, lead-to-opportunity is usually qualified-to-booked, and lead-to-sale is the whole chain below the form.
The multiplication is the point. A ten-point gain anywhere in the chain is worth roughly the same amount of revenue, so the question is never how to lift conversion but which of these five is cheapest to move.
Look at where the recoverable loss sits in that week. The lowest rate is the closing step at 30.8%, and that is normal: closing is hard and expensive to improve. The cheapest loss is one row above it.
Five booked meetings never happened. Had those five gone ahead and closed at the same 30.8%, the week would have produced about 5.5 customers instead of 4, from identical traffic and identical spend. That is a 38% swing with no new leads, and it is invisible in any report that ends at the booking confirmation.
One caveat on that arithmetic: people who skip a meeting probably close below the average of those who attend, so treat 38% as the ceiling of the opportunity, not a forecast.
If you want to run this on your own funnel this week, meetergo's free plan is enough to get the form and the stage history into one place: create a free account, point one form at it, and you have the first two denominators recorded from the start.
The stage nobody counts: booked to held
Published benchmarks for this metric overwhelmingly stop at the booked meeting. Lead-to-opportunity, MQL-to-SQL, lead-to-sale and visitor-to-lead all have well-known formulas. Booked-to-held rarely appears, and attendance is the one field no system fills in by itself.
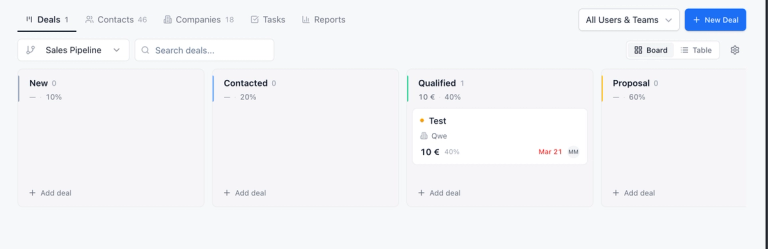
The reason is mechanical. A form submission creates a record. A booking creates a record. A deal moving between stages creates a record. Whether the person turned up is known only to whoever sat waiting on the call, and unless they change something afterwards, the funnel keeps that meeting on the books.
Two practical consequences:
- Your qualified-to-booked rate flatters you. If the metric you report to leadership is bookings, a prospect who books three times and attends nothing counts as three wins.
- Your sales cycle looks shorter than it is. Rescheduled meetings sit between the booking date and the real conversation, and usually only the first date gets stored.
The fix is unglamorous. Add one explicit outcome to every booked meeting (held, no-show, rescheduled) and make it a required step before the deal can advance. meetergo's automated workflow reminders send confirmations and email or SMS nudges before the slot, but the held rate is the only way to know whether reminders like those are doing anything.
Which system holds each denominator
This is where most measurement projects stall. The five rates need numbers from different tools, and each tool has its own failure mode.
| Rate | Numerator comes from | Denominator comes from | What usually goes wrong |
|---|---|---|---|
| Visitor to lead | Form tool or CRM | Web analytics | Bots and repeat sessions inflate the visitor count, so the rate reads low |
| Lead to qualified | CRM | Form tool or CRM | No written qualification rule, so two reps qualify differently |
| Qualified to booked | Booking tool or calendar | CRM | Meetings arranged by email never enter the booking tool and vanish from the count |
| Booked to held | The person who ran the call | Booking tool | Nothing records attendance automatically |
| Held to customer | CRM | CRM | The attribution window is never fixed, so late deals land in the wrong cohort |
When two systems disagree on the lead count, and they will, take the denominator from the system where the lead is created and the numerator from the system where the outcome is decided. Submissions come from the form, customers from the CRM. Write that direction into the report itself, so the next person to open the dashboard does not recalculate it their own way.
One more rule worth adopting early: never average two conversion rates. A source converting at 20% on 10 leads and one converting at 5% on 400 leads do not combine to 12.5%. Add the numerators, add the denominators, divide once.
What moves each of the five rates
Each transition responds to different work, which is why one improvement project aimed at conversion in general tends to move nothing in particular.
- Visitor to lead: form friction and the match between the form and the page it sits on. Every required field you remove is one less decision you ask a stranger to make.
- Lead to qualified: the written qualification rule, and the quality of the source feeding it. Rewriting the rule moves this rate without anything changing in the business, which is why the rule belongs in the report.
- Qualified to booked: response time, above everything else. An enquiry answered in minutes books at a different rate from the same enquiry answered tomorrow.
- Booked to held: the gap between the booking and the slot, plus reminder cadence. Meetings booked further out are held less often, so offering nearer slots is a measurement change and a revenue change at once.
- Held to customer: fit and the offer. The most expensive stage to move, and usually the last one worth touching.
Rank the five by what a ten-point gain would be worth against how hard it looks, then work the top one only. The figure that matters commercially sits one level up: customers divided by acquisition spend. Your stage rates are how you find which part of that spend buys leads that never reach a conversation.
What counts as a good lead conversion rate
The honest answer is that nobody publishing an average for this metric can usually tell you which of the five transitions it measures, or on which population.
Scan the figures in circulation and you find the same label attached to visitor-to-lead, to lead-to-customer and to MQL-to-SQL, three transitions whose normal values sit nowhere near each other. Comparing your number to any of them is a coin flip on whether you are comparing like with like, which is why this article does not reproduce a benchmark table.
Two comparisons that do work, on top of the stage ranking above:
- Your own previous period, same definitions. The only comparison where the denominator is guaranteed to match.
- Source against source, inside your own data. Paid search against referrals against outbound, same week, same definitions. This is where budget decisions get made, because money moves between sources and not between industries.
If you want an external number anyway, insist on three things first: the exact transition measured, the sample size, and the date. A figure missing any of the three is decoration.
Recording the five rates without a reporting project
Small teams rarely leave this unmeasured for lack of analytics skill. The capture point, the stage history and the meeting record sit in three tools bought at different times, so the join is done by hand each month.
meetergo closes most of that gap by making the booking the record. Anyone who submits a form or books a slot becomes a contact, and meetings, emails and chat threads then accumulate on that contact, so the lead count and the meeting history arrive already joined.
What that gives you per rate:
A denominator you did not have to export
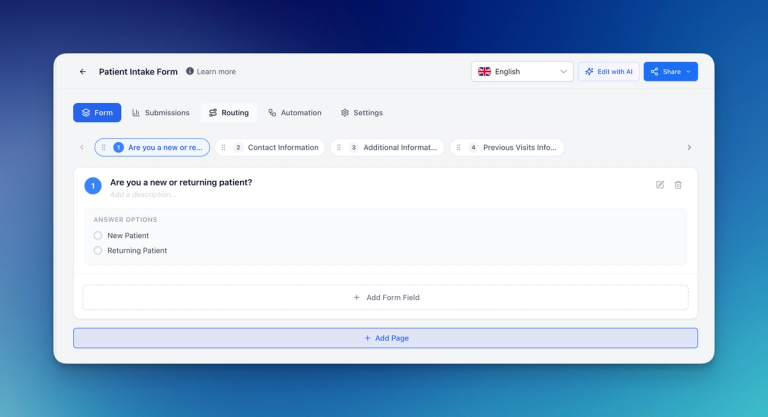
A routing form is the capture point, and every submission lands as a contact whether or not it goes on to book. That is the total-leads figure, recorded at the moment it happens rather than reconstructed later from an email inbox.
Stage timestamps you did not have to type
Automations can create a deal when a form is submitted and set its opening stage, so the lead-to-qualified and qualified-to-booked transitions get recorded without anyone remembering to log them. If your pipeline already lives elsewhere, the calendar and CRM sync patterns for Pipedrive cover how the same stage history behaves when the deal record stays in your existing CRM.
Stage conversion and cycle length in the reporting view
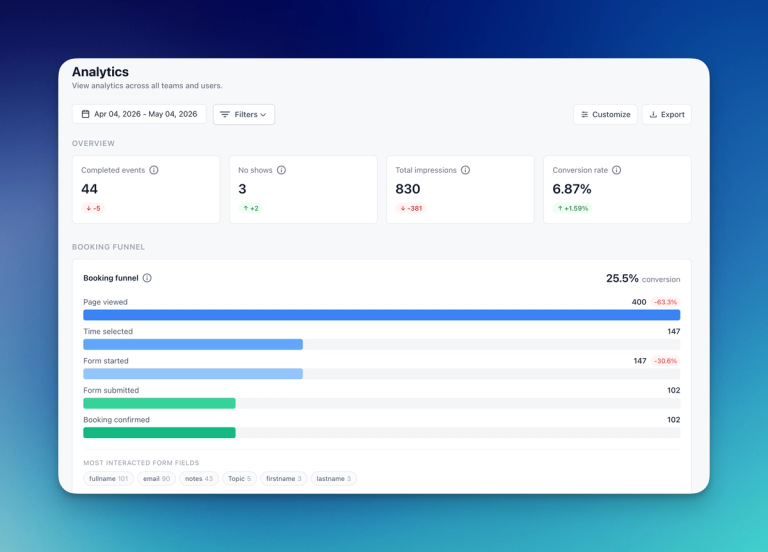
The CRM's reporting shows won and lost counts, average sales cycle, average won deal value and stage-to-stage conversion, which covers the bottom two transitions of the chain.
Where it stops, and this matters for the chain above. meetergo reports no attendance rate. Booked-to-held is a stage you create yourself, and whoever ran the call sets its outcome. Visitor counts are missing on the lower plans too: visitor identification sits on Premium and is capped by company per month, so that denominator keeps coming from your web analytics. Two of the five rates are handed to you; the other three need a decision first.
Every plan carries the CRM. The free one holds 10 deals for up to three people; unlimited deals start on Light at €12.90 per person a month on yearly billing, and the paid plans run a seven-day trial with no card (all checked 2026-11-21).
Measure your five conversion rates in one place.

Measure your five conversion rates in one place.
Start where the measurement is cheapest: put one form in front of your highest-volume source, let the CRM record the stage history for a month, then open a free account and run the five divisions above on real numbers instead of estimates.
Frequently asked questions
What is a good lead conversion rate?
Good is your previous period's rate, measured the same way, plus whatever the cheapest stage gain was worth. The published averages mostly fail to state which transition and which population they describe, so they cannot tell you whether your 6% is a problem or a win.
What is the difference between lead conversion rate and close rate?
Close rate measures the last transition only, usually from a sales-accepted opportunity to a signed customer. Lead conversion rate can describe any transition in the funnel, which is exactly why it gets reported inconsistently. If you use both, define the entry stage for each in the same sentence.
How often should you recalculate it?
Monthly for reporting, with a cohort window long enough to cover your real sales cycle. If deals take 23 days to close on average, a weekly rate is measuring the sales cycle rather than conversion, and it will swing for reasons that have nothing to do with performance.
Does the lead source change the rate?
Substantially, and this is the split worth building first. Inbound enquiries that chose you convert at a different rate from outbound lists that did not, and self-booked meetings behave differently from meetings arranged by a rep. Fast follow-up on new enquiries moves the qualified-to-booked step more than most copy changes do.
What is the difference between visitor-to-lead and lead-to-customer conversion rate?
Different denominators on the same funnel. Visitor-to-lead divides submissions by website visitors and usually lands in the low single digits. Lead-to-customer divides customers by submissions and runs higher. Multiply the two and you get visitor-to-customer, which is the figure to compare against acquisition cost.
What does lead conversion mean inside a CRM?
In most CRMs it is a specific action: a lead record is converted into a contact plus an opportunity or deal. That event is a useful numerator for the lead-to-qualified step, but it is a system action rather than a commercial outcome, so do not report it as a customer. Keep your qualification criteria written down separately from whatever button the CRM calls Convert.